About
In the paragraphs that follow you will find a text version of my latest poster, which was presented at the 14th International Conference on Environmental Science and Technology. The conference took place in Rhodes (Greece) during the first week of September. The poster is a summary of the corresponding paper. If you are interested in road transport emissions you might find it interesting!
Overview
Abstract
- The current study examines the evolution of road transport emissions during the years 2012 – 2014 in Thessaloniki, the second-largest city in Greece. The study focuses on the calculation at the micro/link level of CO, NOx and VOC emissions.
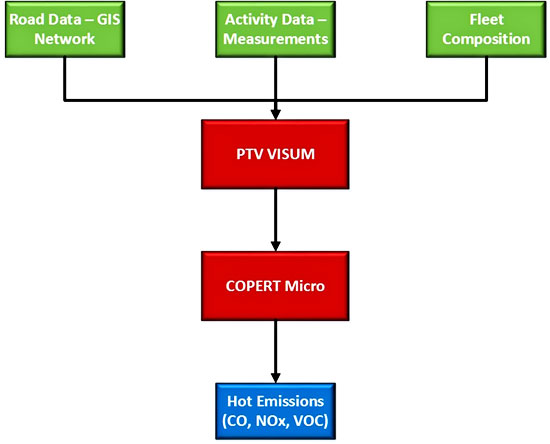
- The developed methodology was based on the combination of PTV VISUM and COPERT Micro models, along with measured traffic data from inductive loop detectors, cameras and radars installed at 37 locations across the city.
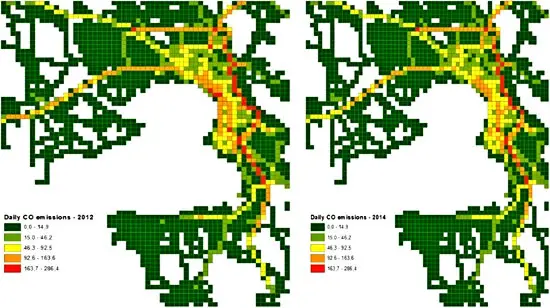
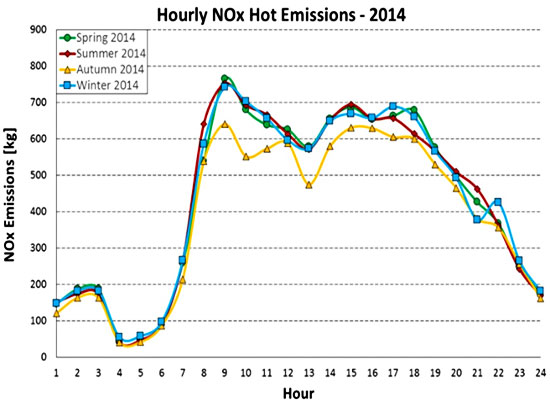
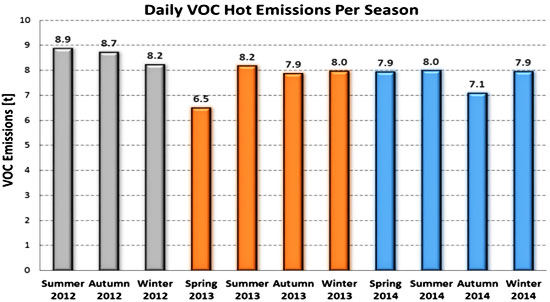
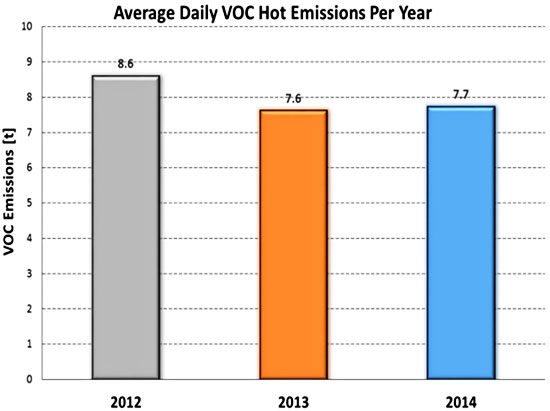
- Results indicated the local pollution hot-spots, as well as the local and seasonal variation of pollutants. In general, there is a substantial drop in average annual emissions between 2012 and 2013, whereas a constant trend is observed between 2013 and 2014.
Introduction
- According to the latest census (2011), Thessaloniki is the second-largest city in Greece, both in population and area.
- Based on the latest transportation study conducted between 2010 and 2013, the average daily private vehicle traffic on the main roads of the city reaches 1.300.000 vehicle-trips, while the morning peak corresponds to 14% of the daily total.
- The main streets in the central area of the city serve daily volumes of through traffic that reach 45% of traffic volumes recorded at peak periods (morning travel to work and afternoon travel back from work to home).
Materials & Methods
Traffic Modelling
- The transportation model for Thessaloniki has been developed with the PTV VISUM software. The network consists of 137.938 directed links, 47.838 nodes and 339 traffic analysis zones connected to physical nodes of the road network via 3.508 connectors.
- The demand side is comprised of 24 hourly Origin-Destination (OD) matrices and the travel demand for a typical weekday is within the range of 1.298.745 vehicle trips.
- The obtained OD matrices are corrected using the hourly volume data measured by inductive loop detectors, cameras, and radars installed at 37 locations across the city. The OD matrix correction is performed with a fuzzy-set based matrix correction procedure.
Emissions Modelling
- The emissions calculations were performed with COPERT Micro, a specially developed version of COPERT 4 for urban areas. It is a bottom-up model, thus, it can calculate the emissions from a single traffic link up to an entire city, focusing primarily on hot exhaust emissions.
- The equations below summarize the main methodology that is applied by COPERT Micro:
– EFi(V)= fEF (V) : emission factor as a function of average vehicle speed
– Emissionsi, j = Lj × Nj × Pvehcile category, j × EFi(V) : emissions due to a single traffic link
– Emissionsi, area = ∑Emissionsi, j: emissions from the entire area
Results & Conclusions
Results
Conclusions
- The results at the link level revealed the local pollution hot-spots and the high-emission links, which usually lie along the main urban highways of the city.
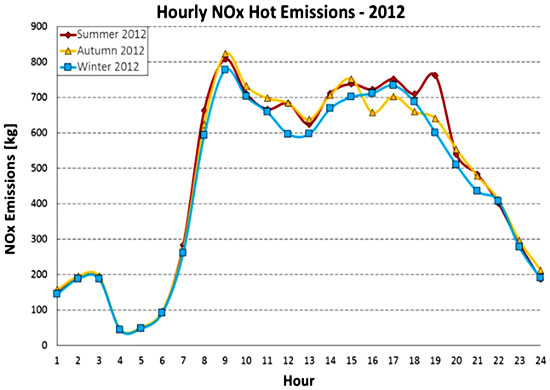
- The seasonal variation of pollutants is mainly caused by the different transport activity patterns in each season.
- There is a significant drop in average annual emissions between 2012 and 2013, while a constant trend is observed between 2013 and 2014. This could be allocated to the reduced transport activity throughout the city, mainly affected by the economic crisis.
More on road transport emissions
COPERT Micro: A Tool To Calculate The Vehicle Emissions In Urban Areas
Micro And Macro Modelling Of Cold Start Emissions From Road Traffic: A Case Study In Athens
