Introduction
The previous October, I successfully defended my Ph.D. thesis entitled “Mesoscale Modeling Of The Impacts Of Congestion And ITS Measures On Vehicle Energy Consumption And Greenhouse Gas Emissions Over Urban Road Networks.”
Due to the COVID-19 pandemic, the entire event took place online. After presenting and answering all the questions, the examination committee announced the following:
The examination committee unanimously recommends to the Department of Mechanical Engineering the proclamation of Mr. Christos Samaras, Mechanical Engineer, as a Doctor of the Mechanical Engineering Department of the Aristotle University of Thessaloniki, and graded his Thesis as “Excellent”.
So, a long journey finally ended. If you are curious how I spent about a decade of my life, check the executive summary below. In the downloads section, you will find a link for the entire thesis.
Executive summary
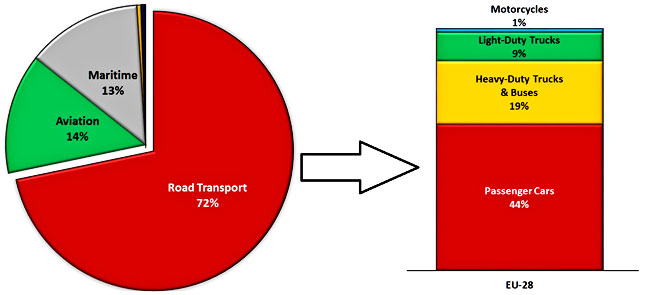
Global warming and the associated climate change are among today’s greatest problems, primarily caused by greenhouse gases (GHG) produced by fossil fuels’ combustion. In Europe, the transport sector is responsible for about 25% of the total human-made GHG emissions, 72% of which can be allocated to road transport. In addition to GHG emissions’ global problem, road transport is a major public concern due to its impact on air quality in urban areas. In this context, much of the effort dedicated to reducing GHG and pollutant emissions has been focused on the road transport sector. Towards this goal, several measures have been suggested, including a shift to cleaner modes of transport, improved vehicle technologies, the use of Intelligent Transportation Systems (ITS), and others.
For the successful simulation of conventional and ITS measures, a combination of traffic and emission models is required. The integration of traffic and emission models can be made at various levels of vehicle aggregation. The detail required depends on the objective and other constraints, such as data availability and computational time requirements. The scope of this study is to present new methods and tools that can be incorporated in average speed emission models to improve the estimation of fuel consumption, CO2, and other pollutant emissions in urban road networks. The new methods, which involve both traffic and emissions modeling at different spatial and temporal scales, can enable a reliable assessment of the effects of conventional, ITS, and other advanced traffic control systems.
The first of these new methods developed is a bottom-up average speed – mesoscale methodology incorporated in a tool called COPERT Micro. COPERT Micro is an Excel/VBA-based tool that calculates vehicle pollutant emissions in urban areas. Provided the necessary road and traffic data, it can calculate the hot exhaust road transport emissions at higher spatial resolution (traffic link level) compared to existing average speed models. The core of its methodology is based on emission factors of COPERT 4. COPERT Micro can calculate the emissions from various pollutants and GHG, while its database contains emission factors for 230 different vehicle categories.
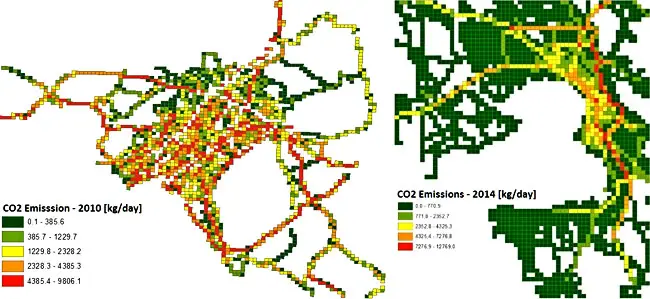
COPERT Micro can assist experts in compiling city-scale and other micro-inventories. The software can reveal the localized hot spots on a given road network. Simultaneously, it can calculate the hourly and daily emissions to evaluate the emission changes within a given time frame. Moreover, it can run several scenarios investigating the effects of policy measures and the introduction of new technologies on road transport emissions produced in a particular area. COPERT Micro has been used in several micro and city-scale inventories, revealing the following:
- In the Municipality of Pilea-Hortiatis, Greece (2011 data), the daily fuel consumption calculated close to 37.5 t, from which 82.60% was gasoline, 17.35% diesel, and only 0.05% LPG. In that area, about 118 t of CO2 emitted into the atmosphere, 91.65% of which coming from private and the rest from public vehicles.
- The construction of a new road in Braće Jerković, Serbia (2010 data) would be beneficial in respect of emissions, since it could lead to a daily reduction of 7% to 10%, depending on the pollutant examined.
- In 2020, Athens, Greece, is expected to have lower emissions compared to 2010 (up to 33% reduction depending on the pollutant) due to a shift towards “cleaner” vehicle technologies (Euro 5 and Euro 6). A possible application of a low emissions zone would be beneficial for the city since it would further reduce emissions.
- A 10% drop in average annual emissions was observed between 2012 and 2013 in Thessaloniki, Greece, indicating the reduced transport activity throughout the city, mainly affected by the economic crisis.
- The CO2 per capita GHG index for Athens and Thessaloniki was found 632 and 796 kg, respectively, which was relatively lower than the average world values. However, this qualitative comparison referred to different years (2010 for Athens and 2014 for Thessaloniki). Passenger cars and secondarily light-duty vehicles were the vehicle categories that mainly contributed to GHG in both cities. On the other hand, two-wheel vehicles should also be taken into account in respect of CH4 emissions.
Despite the promising results from applying the new bottom-up average speed – mesoscale methodology on numerous micro-inventories, several questions were raised that had to be further addressed. More precisely:
- Is there any cold-start methodology that can be implemented in mesoscale emission tools like COPERT Micro?
- How to enhance traffic and emission models to calculate the impact of ITS measures on energy and road transport emissions?
- Is there a minimum road length below which the average speed approach fails to calculate fuel consumption and emissions accurately?
- Is there any specific congestion range outside of which the average speed approach cannot correctly estimate fuel consumption and emissions? What can be done to correct the emission factors to be applied to any congestion level if such a range exists?
A top-down mesoscale methodology was developed based on the work conducted under the ARTEMIS project to address the first question. One of the ARTEMIS project tasks was to develop an improved empirical model for cold-start excess emissions from passenger cars, including parameters such as the pollutant, the vehicle type, and the driving conditions, by using all the existing data in Europe. Three different models were developed to calculate cold-start excess emissions using the types of information available to the user.
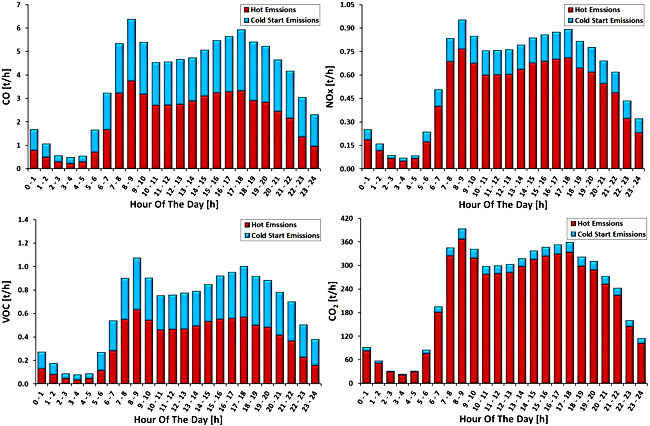
The first of the three ARTEMIS models for calculating CO, NOx, VOC, and CO2 cold-start emissions from passenger cars was incorporated into COPERT Micro. The particular model expresses the cold-start excess emissions per start for a particular vehicle type and a given pollutant/greenhouse gas as a function of the ambient temperature, the mean speed during the cold period, the traveled distance, and the parking time. The application of the methodology was demonstrated in the Metropolitan area of Athens (2010 data), concluding in the following:
- The cold-start emissions constitute a major contributor to CO and VOC road transport emissions (45% and 44%, respectively), whereas their impact on total daily NOx and CO2 emissions is relatively smaller (21% and 7%).
- In specific road sections, which usually belong to the city’s main boulevards, the contribution of cold-start emissions is dominant (sometimes >50%, as in the case of CO), thus significantly affecting local air quality.
- In road networks, specific cold-start allocation modeling activities have to be developed to correctly distribute the impact of cold-start emissions, particularly for local hot spots.
To assess ITS’s impact, an innovative methodology was developed that effectively couples an enhanced traffic microsimulation model (AIMSUN) with a detailed vehicle instantaneous emissions model (AVL CRUISE) to take precisely into account the effects of both operation dynamics and vehicle performance. The micro traffic model was enhanced by an improved car-following law and was calibrated to replicate measured driving patterns over an urban corridor in Turin, Italy, operating under adaptive urban traffic control (UTC).
The methodology was implemented to study the impact of congestion on fuel consumption for Euro 5 diesel <1.4 l passenger cars. Free flow and congested conditions led to respective consumption differences of −25.8% and 20.9% over normal traffic. COPERT 5 rather well predicted the impact of congestion but resulted in a much lower relative reduction in free-flow conditions. A start-stop system was estimated to reduce consumption by 6% and 11.9% under normal and congested conditions, respectively.
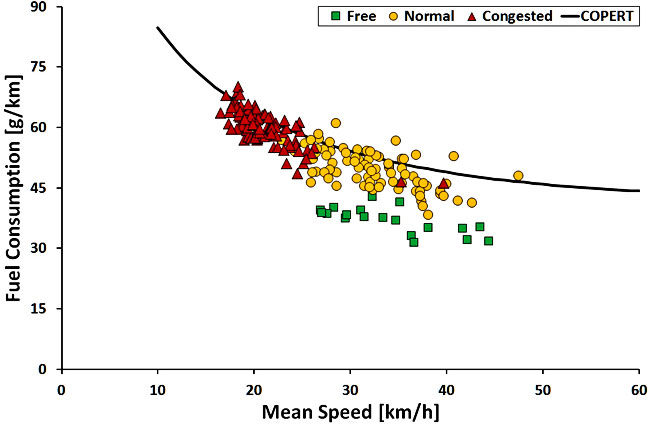
Using the same modeling approach, UTC was found to positively impact CO2 emissions of 8.1% and 4.5% for normal and congested conditions, respectively, considering the Turin vehicle fleet mix for 2013. Overall, the case study demonstrated that the combination of detailed and validated micro traffic and emissions models offers a powerful combination to study traffic and powertrain impacts on fuel consumption and GHG of on-road vehicles over a city network.
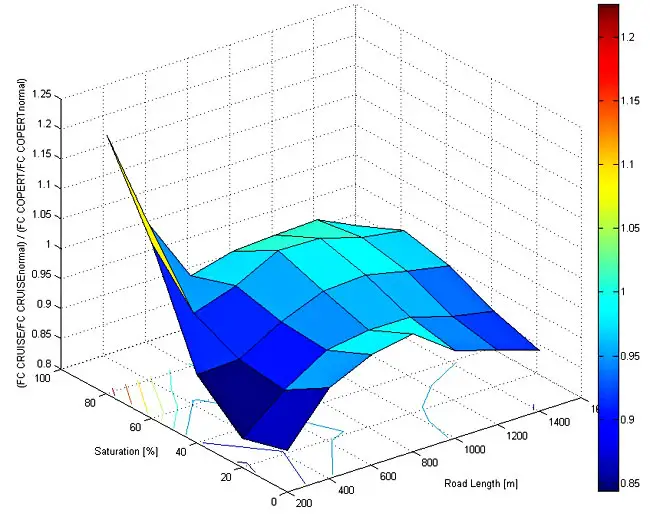
To examine the limits of the average speed approach’s applicability, a real-world experiment was set up, utilizing two traffic sites monitored by the ICT-Emissions project. The first one was located in Madrid (M30 urban highway) and the second one in Turin (Corso Lecce urban corridor). Fuel consumption from the particular traffic sites was calculated at the macro level with COPERT (average speed approach) and the micro-level using second-by-second speed profiles of real vehicles, with AVL CRUISE. The general trends of the COPERT expressions were then compared with micro-simulation results, and conclusions on the average speed approach’s applicability have been reached.
There was a good agreement between COPERT and AVL CRUISE relative fuel consumption differences over a reference condition in most of the driving situations examined. However, the agreement degraded when moving to high saturation and short road distances. As general guidance, COPERT reliability increases as the link length increases above 400 m and the saturation level drops below 80%. If shorter distances need to be modeled at a macro level, it would be safer to aggregate short links to larger conglomerates. Moreover, specific corrections would be necessary when saturation exceeds approximately 80%.
In the latter case, the fuel consumption refinement of average speed models was achieved using the output from the aforementioned integrated microsimulation approach to developing new average speed – fuel consumption functions that can be utilized by an average speed model (COPERT). The methodology to develop new functions involved several statistical calculation processes using data from both micro and macro emission models and curve fitting. The integrated methodology was applied in Turin’s urban corridor using two validated vehicle models of Euro 5 passenger cars.
Three traffic conditions were examined, corresponding to free-flow, normal and congested traffic. New average speed – fuel consumption functions were developed for free and congested traffic, which successfully estimated the differences in fuel consumption when moving from normal to other conditions. Comparison with literature data showed that this study’s congested conditions represent typical urban traffic conditions, while this was not the case for free-flow conditions.
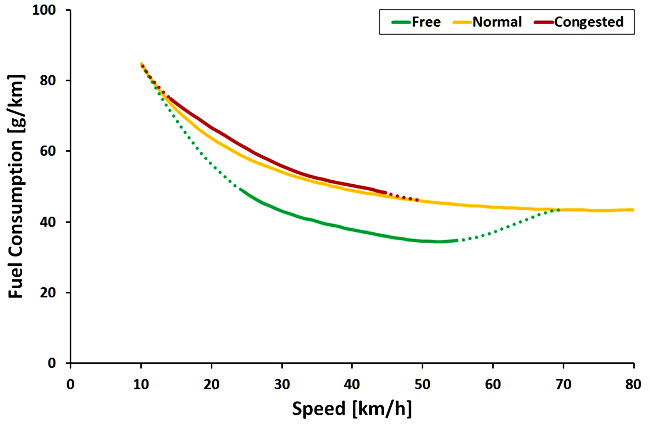
The results also showed that under congested conditions, the fuel consumption could increase by more than 18% in some cases, indicating the significance of incorporating similar congestion algorithms in average speed emission models. Moreover, if a more comprehensive method does not exist, the standard COPERT functions could be used to estimate fuel consumption under congested traffic conditions.
Downloads
The link will send you to the Greek National Archive of Ph.D. theses, where you can read the entire thesis online for free.
Read also
COPERT Micro: A Tool To Calculate The Vehicle Emissions In Urban Areas
Road Transport Emissions Evolution In Urban Areas; The Case Of Thessaloniki, Greece
Micro And Macro Modelling Of Cold Start Emissions From Road Traffic: A Case Study In Athens

